

Help >
开发指南 > 窗体开发 > 控件参考 > 控件参考 > 图表 > SmFlexChart > 属性 >
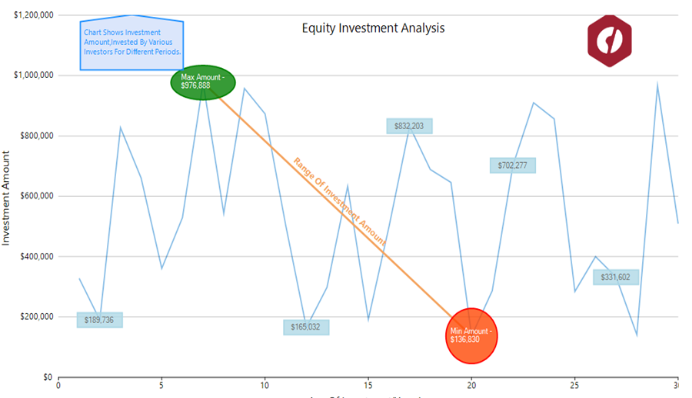
附注
附注是用户定义的对象,例如文本,图像或形状,可以添加到图表中,以使它们更具信息性,同时在美学上增强它。注释中的额外信息通常是为了让读者更好地理解图表而添加的。
FlexChart
通过 C1
提供以下八种类型的注释。命名空间,使您的图表更具吸引力和信息量。命名空间提供了一个与每个注释相对应的类,该类提供了设置其维度等的属性。还可以使用这些批注类提供的属性来定位批注或设置批注样式。此外,通过使用类的
TooltipText 属性,可以以工具提示的形式将其他信息添加到这些批注中。
| 批注类型 | 描述 |
| Line | 指可以使用“开始”和“结束”属性指定其终结点的直线。它还提供 Content 属性,用于呈现行批注上方的文本。 |
| Circle | 在绘图区中呈现一个圆形形状,其半径通过 Radius 属性指定。类提供的内容属性允许您在此批注中绘制文本。 |
| Ellipse | 向图表添加一个椭圆,其维度通过“高度和宽度”属性定义。与其他闭合形状类似,Content 属性允许您呈现此批注中的文本。 |
| Rectangle | 在图表绘图区中创建具有指定高度和宽度的矩形形状。此外,Content 属性允许您在此批注中添加文本。 |
| Square | 在绘图区上绘制一个正方形,其边长由 Length 属性定义。与其他闭合形状类似,Content 属性允许您呈现此批注中的文本。 |
| Polygon | 添加一个多边形,其顶点可以通过 Points 属性添加,该属性获取顶点点的集合。此类还提供一个 ContentCenter 属性,该属性指定使用 Content 属性添加的文本的中心。 |
| Image | 在绘图区上呈现图像,以获得无与伦比的视觉效果。可以通过 SourceImage 属性指定图像源,而可以使用“高度和宽度”属性调整图像大小。借助工具提示,可以使图像注释更具信息性。 |
| Text | 以通过 Content 属性指定的文本形式绘制附加信息。 |
要向图表添加注记,请使用注记图层类创建注记图层,并将注记添加到此注记图层的注记集合中。
| Vb.Net |
'Create an annotation layer using AnnotationLayer class which takes the FlexChart object as its parameter Dim annotationLayer As New C1.Win.Chart.Annotation.AnnotationLayer(flexChart1) 'Step1: Create instances of Annotation 'Create a rectangle annotation Dim rect As New C1.Win.Chart.Annotation.Rectangle("Maximum Sales" & vbLf & vbLf & "$8675") 'Create an image annotation Dim img As New C1.Win.Chart.Annotation.Image() ' create an instance of the Line annotation Dim text As New C1.Win.Chart.Annotation.Text() 'Step2: Set properties explicit to types of annotation 'Set the source image for the Image annotation img.SourceImage = Image.FromFile("Resources/C1.png") ' specify the content for Text annotation text.Content = "Minimum Revenue ever generated" 'Step3: Specify size for annotation 'Specify the annotation dimensions rect.Height = 50 rect.Width = 140 img.Height = 50 img.Width = 50 'Step4: Add Annotation instances to Annotation Layer 'Add annotation to the annotations collection of the annotation layer annotationLayer.Annotations.Add(rect) annotationLayer.Annotations.Add(img) annotationLayer.Annotations.Add(text) |
| C# |
//Create an annotation layer using AnnotationLayer class which takes the FlexChart object as its parameter C1.Win.Chart.Annotation.AnnotationLayer annotationLayer = new C1.Win.Chart.Annotation.AnnotationLayer(flexChart1); //Step1: Create instances of Annotation //Create a rectangle annotation C1.Win.Chart.Annotation.Rectangle rect = new C1.Win.Chart.Annotation.Rectangle("Maximum Sales\n\n$8675"); //Create an image annotation C1.Win.Chart.Annotation.Image img = new C1.Win.Chart.Annotation.Image(); // create an instance of the Line annotation C1.Win.Chart.Annotation.Text text = new C1.Win.Chart.Annotation.Text(); //Step2: Set properties explicit to types of annotation //Set the source image for the Image annotation img.SourceImage = Image.FromFile("Resources/C1.png"); // specify the content for Text annotation text.Content = "Minimum Revenue ever generated"; //Step3: Specify size for annotation //Specify the annotation dimensions rect.Height = 50; rect.Width = 140; img.Height = 50; img.Width = 50; //Step4: Add Annotation instances to Annotation Layer //Add annotation to the annotations collection of the annotation layer annotationLayer.Annotations.Add(rect); annotationLayer.Annotations.Add(img); annotationLayer.Annotations.Add(text); |
有两个方面决定了注释在图表上的位置,一个是注释相对于数据点的位置,另一个是注释如何附加到图表,即它相对于图表的位置。可以通过设置 Position 属性在数据点的左侧、右侧、顶部或底部显示批注,该属性接受来自 AnnotationPosition 枚举的值。
若要相对于图表定位批注,FlexChart 提供了“附件”属性。此属性接受来自批注附件枚举的以下值。
附件属性的值
描述
Absolute
无论应用程序的大小如何调整,注释都保持固定。在这种情况下,注释的位置以像素为单位指定。
DataCoordinate
注释附加到特定数据点。在这种情况下,批注的位置是通过在位置属性中指定数据坐标来定义的。
DataIndex
批注根据 SeriesIndex
属性的值附加到序列,并根据 PointIndex 属性指定的值附加到点。
Relative
批注保留其相对于图表的位置和尺寸。在这种情况下,可以使用 Location 属性定义批注的位置。此处,(0,0)
坐标表示图表的左上角,而 (1,1) 表示图表的右下角。
| Vb.Net |
'Specify how to position annotation rect.Attachment = C1.Chart.Annotation.AnnotationAttachment.DataIndex img.Attachment = C1.Chart.Annotation.AnnotationAttachment.Relative text.Attachment = C1.Chart.Annotation.AnnotationAttachment.Absolute 'Set the location of the annotation according to Series and data points rect.SeriesIndex = 0 rect.PointIndex = 6 'Set the location of the annotation img.Location = New PointF(1.05F, 0.28F) text.Location = New PointF(100F, 325F) 'Set the annotation position rect.Position = C1.Chart.Annotation.AnnotationPosition.Bottom img.Position = C1.Chart.Annotation.AnnotationPosition.Center text.Position = C1.Chart.Annotation.AnnotationPosition.Top |
| C# |
//Specify how to position annotation rect.Attachment = C1.Chart.Annotation.AnnotationAttachment.DataIndex; img.Attachment = C1.Chart.Annotation.AnnotationAttachment.Relative; text.Attachment = C1.Chart.Annotation.AnnotationAttachment.Absolute; //Set the location of the annotation according to Series and data points rect.SeriesIndex = 0; rect.PointIndex = 7; //Set the location of the annotation img.Location = new PointF(1.05f, 0.28f); text.Location = new PointF(100F, 325F); //Set the annotation position rect.Position = C1.Chart.Annotation.AnnotationPosition.Bottom; img.Position = C1.Chart.Annotation.AnnotationPosition.Center; text.Position = C1.Chart.Annotation.AnnotationPosition.Top; |
FlexChart 提供了各种属性,允许您自定义批注,使其在图表背景中突出显示。除了与相应批注类提供的尺寸相关的属性外,这些类还提供 Style 和 ContentStyle 属性,以分别自定义批注及其内容。
| Vb.Net |
'Set the annotation style rect.Style.FillColor = Color.FromArgb(200, Color.Transparent) img.Style.StrokeColor = Color.FromArgb(200, Color.Ivory) text.Style.FillColor = Color.FromArgb(200, Color.Ivory) rect.Style.StrokeColor = Color.Blue text.Style.StrokeColor = Color.Red rect.Style.StrokeWidth = 1 text.Style.StrokeWidth = 2 text.Style.Font = New System.Drawing.Font(FontFamily.GenericSansSerif, 9, FontStyle.Bold) 'Customize the content style rect.ContentStyle.StrokeColor = Color.OrangeRed rect.ContentStyle.Font = New System.Drawing.Font(FontFamily.GenericSansSerif, 8.5F, FontStyle.Bold) |
| C# |
//Set the annotation style rect.Style.FillColor = Color.FromArgb(200, Color.Transparent); img.Style.StrokeColor = Color.FromArgb(200, Color.Ivory); text.Style.FillColor = Color.FromArgb(200, Color.Ivory); rect.Style.StrokeColor = Color.Blue; text.Style.StrokeColor = Color.Red; rect.Style.StrokeWidth = 1; text.Style.StrokeWidth = 2; text.Style.Font = new System.Drawing.Font(FontFamily.GenericSansSerif, 9, FontStyle.Bold); //Customize the content style rect.ContentStyle.StrokeColor = Color.OrangeRed; rect.ContentStyle.Font = new System.Drawing.Font(FontFamily.GenericSansSerif, 8.5F, FontStyle.Bold); |